
The Economics of the FIFA World Cup
- A.Enes TEKCAN
- 1 day ago
- 18 min read
The inaugural FIFA World Cup, held in July 1930 in Montevideo, Uruguay, was a modest tournament consisting of just 18 matches, staged in a single city across three stadiums, with the participation of only 13 national teams. Today, however, the tournament has undergone a profound transformation. The 2026 FIFA World Cup, co-hosted by the United States, Canada, and Mexico, has evolved into a massive sporting event comprising 104 matches, involving 48 teams, and taking place across 16 cities and 16 stadiums. This evolution indicates that the tournament's physical scale on the field has expanded by approximately fourfold over a period of 96 years.
This analysis aims to demonstrate the parallel development between the tournament's sporting and physical expansion and the growth of its financial scale. The number of participating teams, host cities and stadiums, match and goal statistics, and attendance figures all serve as direct indicators of the tournament's commercial magnitude. An increase in the number of matches translates into more broadcasting hours, higher ticket sales, and expanded sponsorship exposure. However, as will be discussed in the following sections, sporting growth and financial growth do not always progress at the same pace or in a balanced manner.
An examination of the historical data reveals three major turning points in the tournament's structural development:
Spain 1982: The number of participating national teams was increased from 16 to 24, while the total number of matches rose from 38 to 52.
France 1998: The tournament was expanded to 32 participating teams, with the total number of matches reaching 64.
United States–Canada–Mexico 2026: With 48 teams and 104 matches, the tournament experienced the largest expansion in its history. Compared with the previous format, the number of matches increased by 62.5%.
These three waves of expansion have also served as the principal driving forces behind the growth of the tournament's global commercial revenues.
Figure 1: Number of Participating Countries in FIFA World Cups
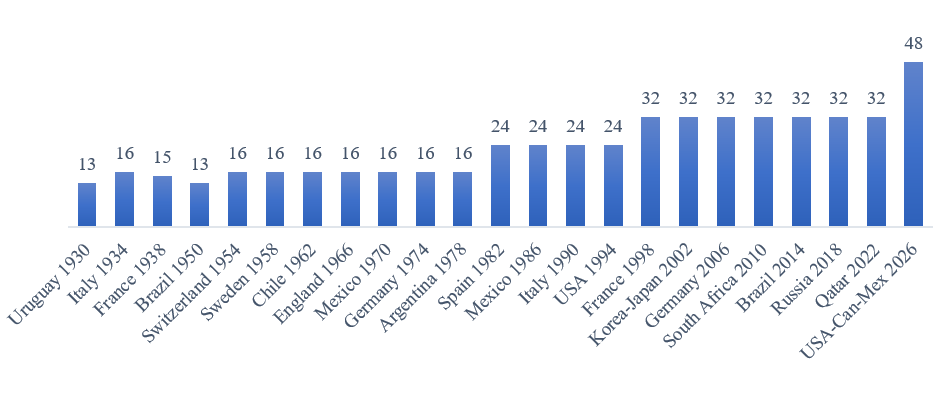
The change in logistical scale is equally striking. While the 2022 FIFA World Cup in Qatar was held within the confines of a single country and eight stadiums, the 2026 tournament is spread across three countries and 16 stadiums. Historical fluctuations in the number of host cities—7 in England (1966), 20 in South Korea/Japan (2002), and 5 in Qatar (2022)—clearly illustrate the relationship between the size of the host geography and the tournament's spatial footprint. The 16 host cities of the 2026 tournament represent the widest geographical distribution in the history of the competition.
This transformation reflects not only a spatial expansion but also the emergence of a new financial model for sharing revenues and costs. The following sections examine, in sequence, the on-field economic indicators (matches, goals, attendance, and ticket prices), FIFA's centralized revenue structure, the financial records unique to the 2026 tournament, the distribution of the prize pool, and the financial burdens borne by the host cities.
The On-Field Economy
i. General Statistics
The commercial value of the FIFA World Cup has grown largely in direct proportion to the sporting performance produced on the field. Statistics show that the total number of goals scored increased from 70 in 1930 to 308 in 2026. However, a different picture emerges when considering the average number of goals per match:
Switzerland 1954: The tournament reached its historical peak with an average of 5.38 goals per match.
The average declined to 2.21 goals per match in Italy 1990 and 2.27 in South Africa 2010, before rising to 2.96 in the 2026 tournament.
Figure 2: Total and Average Number of Goals Scored in FIFA World Cups
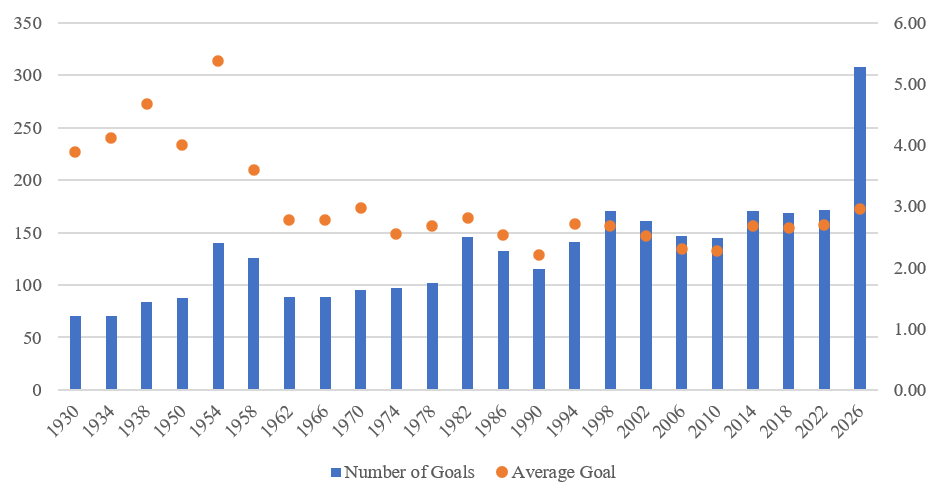
Under the new 48-team format, volume-based indicators such as the total number of goals increase automatically, thereby altering the nature of historical comparisons. Despite the increase in the number of matches, the average number of goals scored per match in 2026 was the highest recorded since the 1970 FIFA World Cup. This increase can be attributed not only to the expansion in the number of participating teams but also to the widening disparity in competitive quality between teams.
In today's sports economy, the goal itself has become a commercial product. The competition between Lionel Messi and Kylian Mbappé for the Golden Boot during the 2026 tournament had a direct impact on television ratings. Mbappé claimed the Golden Boot with 10 goals, while Messi finished second with 8 goals. Individual performance narratives generate compelling storylines that increase advertising revenues for broadcasters and enhance the tournament's overall media value. In the all-time World Cup scoring rankings, Mbappé moved into first place with 22 career goals during this tournament, followed by Messi with 21 goals, while Miroslav Klose ranked third with 16 goals. The breaking of such historical records is among the key factors that enhance both the tournament's viewership and its newsworthiness.
ii. Attendance and Stadium Occupancy
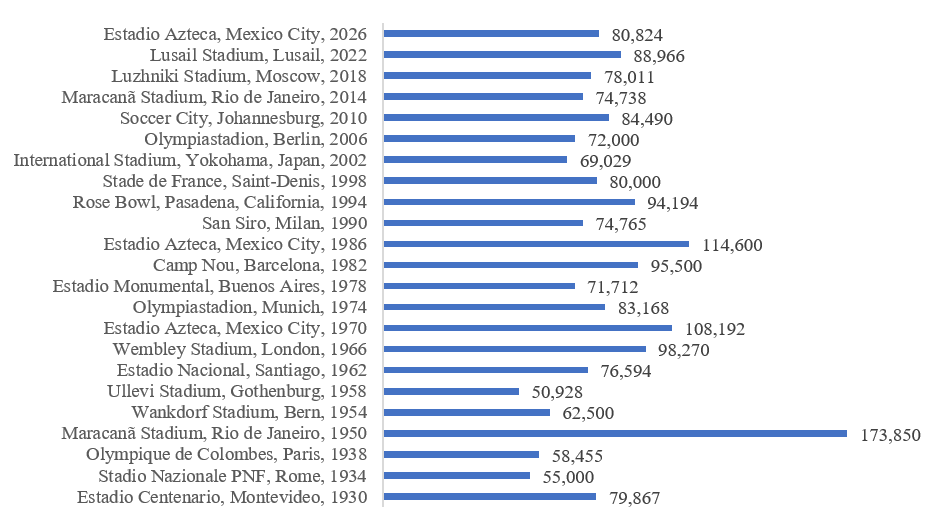
A similar pattern of growth can also be observed in spectator attendance. Total attendance increased from 434,500 spectators in 1930 to 6,810,966 in the 2026 tournament, making it the most attended FIFA World Cup in history. Nevertheless, the record for the highest attendance at a single match still belongs to the Uruguay–Brazil final played at Maracanã Stadium in Rio de Janeiro in 1950, which attracted 173,850 spectators. The fact that this record has remained unbroken for 76 years is largely attributable to the capacity limitations imposed by modern stadiums in order to meet contemporary safety, comfort, and hospitality standards.
Figure 3: Highest Attendance Recorded for a Single Match in FIFA World Cups
Average attendance figures also provide valuable insight into the tournament's spectator density. The record average attendance of 68,991 spectators per match, set during the 1994 FIFA World Cup in the United States, has not yet been surpassed, with the 2026 tournament averaging 65,490 spectators per match. As noted above, this can be explained by the same factors, together with the increase in the number of matches, which resulted in some fixtures attracting comparatively lower attendances.
Figure 4: Total & Average Attendance in World Cups
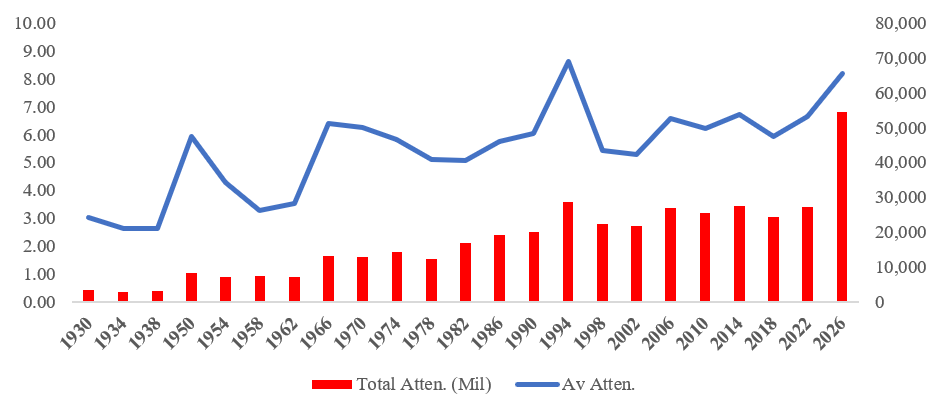
However, high attendance figures do not always translate directly into the expected economic impact. Although the 1994 FIFA World Cup in the United States set an attendance record, economic studies have shown that its actual economic impact fell well short of pre-tournament projections. A similar pattern was observed during the 2026 tournament, where the high cost of tickets resulted in visibly empty seats during some group-stage matches despite the official attendance figures. This illustrates the complex relationship between stadium occupancy and ticket revenue: by adopting a high-price strategy, FIFA can generate substantial revenue even while selling fewer tickets. However, this approach may adversely affect both the stadium atmosphere and the quality of the television broadcast.
iii. Ticket Prices
The historical trajectory of ticket prices has been far steeper than the overall growth of the tournament. While tickets for the World Cup final cost only a few dollars in 1934, inflation-adjusted prices rose to:
US$1,360 at Mexico 1970,
US$1,053 at France 1998,
US$1,813 at Qatar 2022, and
US$10,990 at the 2026 FIFA World Cup.
Even within the most recent tournament cycle alone, the inflation-adjusted upper-tier ticket price increased by approximately sixfold—a far sharper rise than the cumulative increase recorded over the preceding 90 years.
For the 2026 final, premium-category tickets were offered at nominal prices of up to US$32,970, approximately 20 times the highest-priced ticket available for the 2022 final (US$1,607). It has also been reported that even the least expensive official resale tickets for the final reached approximately US$11,000 on the secondary market. Through its official resale platform, FIFA earns a 15% commission from both the buyer and the seller on each transaction. Beyond standard ticket categories, official hospitality providers offered pitchside hospitality packages for groups of 12 starting at US$1 million, private suites for 24 guests starting at US$1.44 million, and exclusive on-field access packages allowing guests to witness the trophy presentation from the pitch at US$600,000 per person. (Forbes, 2026)
World Cup Final Match | Highest Ticket Value (Inf. Adjusted) |
1934 Italy vs Czechoslovakia | $99 |
1938 Italy vs Hungary | $117 |
1950 Uruguay vs Brazil | $8,228 |
1954 West Germany vs Hungary | $123 |
1958 Brazil vs Sweden | $137 |
1962 Brazil vs Czechoslovakia | $131 |
1966 England vs West Germany | $203 |
1970 Brazil vs Italy | $1,360 |
1974 West Germany vs Netherlands | $268 |
1978 Argentina vs Netherlands | $253 |
1982 Italy vs West Germany | $205 |
1986 Argentina vs West Germany | $241 |
1990 West Germany vs Argentina | $303 |
1994 Brazil vs Italy | $1,058 |
1998 France vs Brazil | $1,053 |
2002 Brazil vs Germany | $1,376 |
2006 Italy vs France | $1,261 |
2010 Spain vs Netherlands | $1,362 |
2014 Germany vs Argentina | $1,380 |
2018 France vs Croatia | $1,446 |
2022 Argentina vs France | $1,813 |
2026 Spain vs Argentina | $10,990 |
Source: Givemesport | |
Expenditures beyond ticket purchases also reached substantial levels. In Los Angeles, parking fees reached US$300 per match, hotel accommodation prices increased by approximately 50% on matchdays, round-trip train tickets between New York and New Jersey cost US$98, and beverages at some stadiums were priced as high as US$20. In addition, under FIFA's special program allowing supporters' names to be displayed on stadium screens, fans were charged US$79, excluding taxes. Taken together, these additional expenditures demonstrate that the total cost of attending a FIFA World Cup match in person extends far beyond the price of the match ticket alone.
FIFA's Revenue Structure
FIFA's revenue model is built upon four principal sources of income:
Television and digital broadcasting rights
Sponsorship and marketing rights
Ticket sales and hospitality packages
Licensing rights
Although the relative contribution of these revenue streams varies from one tournament cycle to another, broadcasting rights remain by far FIFA's largest source of income.
During the 2019–2022 financial cycle (culminating in the 2022 FIFA World Cup Qatar), FIFA generated total revenues of US$7.57 billion. The distribution of this revenue was as follows:
Broadcasting Rights: US$3.426 billion (45.3%)
Marketing and Sponsorship: US$1.795 billion (23.7%)
Ticket Sales and Hospitality: US$949 million (12.5%)
Licensing Revenue: US$769 million (10.2%)
Other Revenue: US$629 million (8.3%)
Owing to differences in annual versus four-year reporting periods and variations in accounting classifications, alternative financial statements for 2022 indicate that broadcasting revenues accounted for 51.27% (US$2.958 billion), sponsorship and licensing revenues for 29.38% (US$1.695 billion), and ticketing and hospitality revenues for 16.1% (US$929 million).
i. Growth in FIFA's Four-Year Revenue Cycles (2002–2026)
An examination of FIFA's revenue growth across successive four-year financial cycles reveals a consistent upward trajectory:
South Korea/Japan 2002: Total revenue reached US$1.6 billion. Expansion into the Asian market enabled marketing revenues to exceed the US$1 billion threshold for the first time.
Germany 2006: Revenue increased to US$2.5 billion, driven largely by the professionalization of in-stadium marketing and hospitality sales.
Figure 5: FIFA Revenues (Four-Year Cycles)

South Africa 2010: Total revenue reached US$3.8 billion. As the first FIFA World Cup held in Africa, the tournament generated a significant global increase in broadcasting rights revenues.
Brazil 2014: Revenue rose to US$4.8 billion, with ticket sales and global marketing rights accounting for more than 40% of the total budget.
Russia 2018: Total revenue reached between US$5.2 and US$5.4 billion, of which US$2.8 billion was generated directly from television broadcasting rights.
Qatar 2022: Revenue for the four-year cycle increased to US$7.57 billion, with digital broadcasting and premium VIP hospitality packages emerging as key revenue drivers.
USA – Can – Mex 2026: Owing to record-breaking broadcasting rights revenues (US$3.9–4.2 billion) and the expanded match schedule, total revenue for the four-year cycle is projected to reach between US$13 billion and US$15 billion. Differences among published estimates stem from whether revenues generated by the 2025 FIFA Club World Cup and the 2023 FIFA Women's World Cup are included in the calculations. Nevertheless, both approaches confirm that the 2026 cycle represents nearly a doubling of revenue compared with the previous cycle.
The detailed breakdown of the US$8.9–10.1 billion in commercial revenue generated directly by the 2026 FIFA World Cup is as follows:
Television Broadcasting Rights: 40–42% (approximately US$3.9 billion)
Ticket Sales and Hospitality: 31–33% (US$3.0–3.1 billion)
Marketing and Sponsorship: 28–30% (approximately US$2.8 billion)
Licensing and Commercial Rights: 4–5% (approximately US$0.4 billion)
The record increase in ticketing and hospitality revenues can primarily be attributed to the large capacities of North American stadiums, the expansion of the tournament to 104 matches, and the strong sales of premium VIP hospitality packages. On the sponsorship side, new global partnerships with companies such as Aramco and Lenovo, together with the expansion of the FIFA Partner network, played a decisive role.
ii. FIFA Forward: Redistribution of Revenue
FIFA redistributes a portion of its global commercial revenues to its member confederations and national associations. Under the FIFA Forward Development Programme, direct financial support is provided to member associations to fund operational expenses, infrastructure projects, and football development initiatives.
As part of the FIFA Forward 3.0 programme, implemented during the 2023–2026 cycle, a total of US$2.25 billion has been allocated to FIFA's 211 member associations. Subject to meeting the programme's eligibility requirements, each member association may receive grants of up to US$8 million.
Nevertheless, this funding model has also given rise to debates concerning corporate governance. Critics argue that the fact that the governing body responsible for allocating these funds and the member associations that receive them—while also holding voting rights in FIFA presidential elections—are part of the same institutional structure raises questions regarding institutional independence and governance.
The 2026 FIFA World Cup: Financial Records and a Special Analysis
The organization of the 2026 FIFA World Cup as a joint venture among three host countries has introduced a new dimension to the tournament's financial and logistical risk profile. Unlike the 2014 FIFA World Cup in Brazil, where substantial investments were made in the construction of new stadiums, the 2026 tournament has relied primarily on existing large-scale sports venues, thereby minimizing the risk of post-tournament underutilization. Nevertheless, adapting these stadiums to comply with FIFA's clean venue and commercial requirements—including the installation of natural grass pitches and the standardization of field dimensions—has generated significant expenditures.
In accordance with FIFA's sponsorship and commercial rights policies, all commercial branding incorporated into stadium names was removed throughout the tournament. For example, MetLife Stadium in New Jersey was officially renamed "New York New Jersey Stadium" for the duration of the competition, and existing sponsor signage was covered. To draw attention to this practice, Levi's temporarily replaced its logo on its social media accounts with a modified version referencing the covering of its branding at the stadium in Santa Clara.
The 2026 FIFA World Cup also achieved record-breaking broadcasting audiences:
The United States' opening match, in which it defeated Paraguay, attracted an average of 18 million viewers on Fox, setting a new U.S. ratings record for an English-language broadcast of a men's FIFA World Cup match.
Telemundo and Peacock set a Spanish-language broadcasting record by attracting 13 million viewers for the Mexico–South Africa match.
Across the tournament, Fox averaged 5.9 million viewers per match, while Telemundo averaged 5.5 million viewers per match.
The Brazilian YouTube channel CazéTV set a new digital broadcasting record by reaching 21.1 million concurrent viewers worldwide during a single football match.
Global cumulative viewership for the tournament is estimated to have exceeded 5 billion, while the final match alone is believed to have accounted for approximately 7% of worldwide internet traffic at its peak. The tournament also created new revenue opportunities for broadcasters. The introduction of three-minute cooling and hydration breaks during matches generated an additional 624 minutes of advertising inventory across 104 matches, producing more than US$500 million in additional advertising revenue. This amount exceeded the US$485 million that Fox paid for the tournament's broadcasting rights. Throughout the tournament, 30-second advertising spots were reportedly sold for between US$200,000 and US$750,000.
From the perspective of security and public expenditure, the U.S. Federal Emergency Management Agency (FEMA) allocated US$625 million in grants to the 11 U.S. host cities to strengthen security and cybersecurity infrastructure. Of this amount, US$221 million was specifically designated for protection against unmanned aerial vehicle (drone) threats, and more than 300 unauthorized drones were confiscated around stadiums during the first two weeks of the tournament. Meanwhile, tax exemptions granted on ticket sales by the states of Florida, Georgia, and Missouri are estimated to have resulted in a combined US$57.8 million in forgone tax revenue. FIFA's own operational budget amounted to US$3.8 billion, including US$1.1 billion in operating expenses, US$159 million for transportation, and US$23 million for refereeing services. This figure, however, does not include expenditures incurred by host cities from their own local budgets, which exceeded US$100 million per city in several cases. (Forbes, 2026)
The tournament's financial scale was also reflected in the sports betting market. Prediction platforms such as Kalshi and Polymarket recorded US$5.4 billion in trading volume during the tournament's first week, with the total approaching US$10 billion by the end of the second week. In the regulated U.S. online sports betting market, total wagers placed throughout the tournament are projected to have reached US$4.4 billion, compared with approximately US$1.8 billion during the 2022 FIFA World Cup in Qatar.
Even the iconic FIFA World Cup Trophy—the tournament's symbolic centerpiece, crafted from 18-karat gold and weighing 5 kilograms—experienced a significant increase in financial value. Driven by rising gold prices, the intrinsic value of the trophy's raw gold is estimated to have increased by approximately 2.5 times compared with 2022, reaching roughly US$713,000.
i. Prize Pool
The FIFA World Cup's prize money structure has expanded in parallel with the tournament's commercial growth. The total prize and participation package—including teams' preparation, travel, accommodation, and delegation expenses—has reached US$871 million. (The net amount allocated exclusively as performance-based prize money is US$655 million.) This represents a substantial increase compared with the US$440 million total prize pool awarded at the 2022 FIFA World Cup in Qatar.
Stage / Achievement | Prize / Guaranteed Amount per Team |
Participation Fee (Group Stage + Tournament Expenses) | US$12.5 million |
Eliminated in the Group Stage (16 Teams) | US$9 million (guaranteed) |
Round of 32 Qualifiers (32 Teams) | At least US$11.0 million |
Tournament Champion | US$50.0 million (total earnings) |
Source: FIFA | |
Prize money allocated by FIFA is paid not directly to the players, but to the respective national football associations. These associations distribute the funds according to their own collective bargaining agreements and internal regulations. For example, under the collective bargaining agreement signed in 2022, the U.S. Soccer Federation pools all prize money earned from both the Men's and Women's FIFA World Cups into a single fund. It retains 20% for football development within the federation, while the remaining 80% is distributed equally between the players of the men's and women's national teams.
In addition to the prize pool, FIFA makes direct payments to clubs that release players for the tournament through the Club Benefits Programme. During the tournament, a total of US$250 million was distributed to clubs, based on a minimum payment of US$5,000 per player per day. An additional US$100 million was allocated to clubs whose players participated in the qualification stages. This mechanism illustrates the financial network of the FIFA World Cup economy at the club level.
However, the growth in the prize pool has not kept pace with the growth in FIFA's revenues. Between 2022 and 2026, FIFA's four-year cycle revenue increased by approximately 100%, whereas the prize pool expanded by only about 50%. This suggests that a significant share of the additional revenue has been allocated to FIFA's operational expenditures, reserve funds, and infrastructure investment through the FIFA Forward development programme for member associations.
The Imbalance Between Centralized Revenues and Local Costs
One of the central debates surrounding the economics of the FIFA World Cup concerns the asymmetry between FIFA's centralized revenue model and the local costs borne by host cities. While FIFA captures the vast majority of revenues generated through broadcasting rights, sponsorships, ticket sales, and licensing, host cities are left to bear the costs of public expenditures, security, pressure on transportation infrastructure, and the risk of underutilized facilities after the tournament. For many local governments, hosting the tournament can impose a financial burden that makes even reaching the break-even point difficult.
i. Hosting Costs (1970–2026)
The total infrastructure and organizational costs incurred by host countries have risen dramatically over the past half century:
Mexico 1970: US$70 million
Argentina 1978: US$2.7 billion
Italy 1990: US$4.0 billion
South Korea/Japan 2002: US$7.0 billion
Brazil 2014: US$19.7 billion (total public and infrastructure expenditure)
Qatar 2022: US$200 billion (the most expensive FIFA World Cup in history)
United States/Canada/Mexico 2026: US$14 billion (costs were reduced through the use of existing infrastructure)
Qatar's expenditure of more than US$200 billion was approximately 27 times greater than FIFA's US$7.5 billion revenue during the same financial cycle. However, this extraordinary expenditure should not be viewed solely as the cost of staging a sporting event; rather, it represented a broader national development investment encompassing urban development, metro systems, airports, and hotel infrastructure across the country. By contrast, the estimated US$14 billion expenditure for the 2026 FIFA World Cup has remained at a comparatively moderate level, largely because of the availability of existing large-scale stadiums.
Nevertheless, the relatively lower centralized costs of the 2026 tournament do not imply that local expenditures are insignificant. According to Britannica (2026), projected hosting costs for Toronto increased from tens of millions of dollars to approximately US$380 million. In Foxborough, Massachusetts, a town with a population of approximately 18,000, public safety costs for the seven matches to be held at Gillette Stadium reached US$7.8 million. At the request of local taxpayers, these costs are reportedly being covered by Boston Soccer 2026, with support from Kraft Sports & Entertainment. In Mexico, hotel prices in certain host cities reportedly increased by approximately 1,000% prior to the tournament (Britannica, 2026). In the United States, a US$25.8 million temporary jail project planned by Kansas City to address visitor-related public safety issues was not completed in time for the tournament. Meanwhile, Jackson County allocated US$42.5 million in state funding for the renovation of Arrowhead Stadium, which is expected to be vacated by the NFL's Kansas City Chiefs within the next five years (Forbes, 2026).
ii. Case Studies: Brazil 2014 and the United States 1994
Brazil 2014: Brazil spent approximately US$19.7 billion, primarily from public funds, on preparations for the tournament. Forced urban evictions associated with stadium construction projects, together with the scale of public expenditure, generated widespread public opposition. Public opinion surveys indicated that 61% of Brazilians did not approve of allocating public funds to the tournament. Many of the 12 stadiums constructed for the event—such as those in Manaus and Brasília—subsequently became underutilized facilities burdened with high maintenance costs. Shortly after hosting the tournament, the country entered a period of severe economic and political instability.
United States 1994: The 1994 FIFA World Cup attracted more than 3.5 million spectators, achieving an average attendance of 68,991 per match, and was widely regarded as a commercial success. The use of existing NFL stadiums kept construction costs to a minimum. Following the tournament, Major League Soccer (MLS) was established, and the U.S. Soccer Foundation was created. Nevertheless, subsequent economic analyses concluded that the tournament's net economic impact on host cities fell considerably short of the projections made before the event.
iii. The Enduring Legacy of Mega Sporting Events
The legacy of the 2026 FIFA World Cup is taking shape on a structurally different foundation from that of previous host nations. Unlike Brazil or Qatar, the three host countries relied on existing large-scale stadiums already used by the NFL and MLS, rather than constructing new venues. This approach has substantially reduced the risk of creating underutilized "white elephant" facilities, as these stadiums will simply return to hosting regular NFL games, concerts, and other events once the tournament concludes. In this respect, the enduring legacy of the 2026 World Cup lies not in the construction of new concrete infrastructure but in the temporary repurposing and rebranding of existing facilities.
However, the lower risk of creating redundant physical infrastructure does not eliminate the fact that much of the financial burden has shifted to local governments, particularly smaller municipalities. The experience of Foxborough, a town of approximately 18,000 residents, facing US$7.8 million in security costs for just seven matches, and Kansas City's inability to complete planned public safety infrastructure before the tournament, demonstrates that even in large and economically advanced host countries, the financial burden is often felt at the local rather than the national level. Similarly, hotel price increases of up to 1,000% in parts of Mexico illustrate the same pattern in the form of inflationary pressures.
For North America, the central question is whether this tournament will permanently transform the commercial position of football across the region. The 1994 FIFA World Cup in the United States laid the foundation for the establishment of Major League Soccer (MLS). Thirty years later, the 2026 tournament is taking place within a far more mature MLS ecosystem, accompanied by significantly larger broadcasting audiences and a fully integrated market spanning three countries. Furthermore, with Los Angeles scheduled to host the 2028 Summer Olympic Games, the security, transportation, and accommodation systems developed and tested during the 2026 World Cup will not serve as one-time investments but rather as infrastructure capable of supporting successive global mega-events.
Assessment
The 96-year growth trajectory of the FIFA World Cup demonstrates its transformation from a regional tournament featuring just 13 teams into a global commercial enterprise capable of generating up to US$15 billion in revenue over a four-year cycle. This transformation has been driven by a strong parallel between the tournament's on-field expansion—more teams, host cities, stadiums, matches, and spectators—and its commercial growth. However, this relationship is neither linear nor without imbalance. Ticket prices have increased far more rapidly than the number of participating teams; the costs borne by host cities have not always grown in proportion to FIFA's centralized profitability; and record-breaking aggregate figures—such as total goals, matches, and attendance—sometimes reflect nothing more than the expansion of the tournament format rather than genuine increases in sporting quality or economic intensity.
A similar imbalance is evident on the cost side. The cost of hosting the tournament rose from US$70 million in 1970 to US$200 billion in 2022, before declining to approximately US$14 billion in 2026 as a result of the tournament being shared among three countries and relying largely on existing infrastructure. This fluctuation demonstrates that the hosting model—whether based on a single country with extensive new construction or on multiple countries utilizing existing facilities—is the most critical determinant of the tournament's overall cost. It also raises the question of whether the 2026 model will become a blueprint for future FIFA World Cups.
At the same time, the future of the FIFA World Cup economy will depend not only on the tournament's scale but also on the evolving composition of its revenues. Although broadcasting rights have remained FIFA's largest source of income for decades, the rise of digital platforms, direct-to-consumer broadcasting models, data-driven sponsorship agreements, and premium fan experiences is steadily diversifying revenue streams. Conversely, security requirements, cybersecurity threats, climate change-related operational risks, and sustainability obligations are emerging as significant new cost drivers. Consequently, the future economic success of the FIFA World Cup will be judged not merely by the number of matches it stages, but by how effectively it manages these evolving revenue opportunities and cost pressures.
Today, the FIFA World Cup is no longer merely a sporting competition; it has become a global economic ecosystem that simultaneously stimulates the media, tourism, construction, transportation, technology, and entertainment industries. Nevertheless, the economic benefits generated by the tournament and the costs incurred are not distributed evenly among stakeholders. The imbalance between FIFA's increasingly centralized revenue model and the local financial burdens borne by host countries and host cities remains one of the principal issues in the political economy of mega sporting events. Accordingly, future evaluations of FIFA World Cups should focus not only on record-breaking revenues but also on the long-term returns on investment, the post-tournament utilization of infrastructure, and the enduring economic legacy left for host communities.
References
Britannica Money. (2026). Economics of the FIFA World Cup. https://www.britannica.com/money/economics-of-the-FIFA-World-Cup
ElectroIQ. (2026). D'Souza, J. FIFA World Cup Statistics by Records, Teams, Viewership, and Revenue. https://electroiq.com/stats/sports/fifa-world-cup
FIFA. (2023). Annual Report 2022. FIFA. https://inside.fifa.com/about-fifa/reports/annual-report
FIFA. (2023). Financial Report 2022. FIFA. https://inside.fifa.com/about-fifa/reports/financial-report
FIFA. (2023). FIFA Forward Development Programme 3.0. FIFA. https://inside.fifa.com/about-fifa/development/fifa-forward
FIFA. (2026). 2026 FIFA World Cup™. https://www.fifa.com/en/tournaments/mens/worldcup/canadamexicousa2026
Forbes. (2026, July 1). Knight, B. The Numbers Behind the 2026 World Cup. https://www.forbes.com/sites/brettknight/2026/07/01/the-numbers-behind-the-2026-world-cup



Comments