
United Kingdom Monthly Outlook – July 2026
As the UK enters the second half of 2026, its economy is showing more resilience than expected, despite the shadow of the energy price shock triggered by the Iran war. The conflict, which began in late February and led to the near-total closure of the Strait of Hormuz, caused oil prices to briefly rise above $100 per barrel, reviving inflationary pressures through energy, transport, and production costs. Even so, the latest data released by the Office for National Statistics (ONS) shows the economy continuing to grow for a sixth consecutive quarter, led by the services and construction sectors.
Alongside this economic picture, the UK has also seen a major political shift. Prime Minister Keir Starmer resigned from both the premiership and the Labour Party leadership on 22 June 2026. He was succeeded by former Greater Manchester Mayor Andy Burnham — known as the "King of the North" — who took office as the 59th Prime Minister on 20 July 2026, becoming the seventh PM to serve in the past decade. Formally invited by King Charles III to form a government, Burnham pledged in his first speech to ease the cost of living, decentralize political power, revive industry, and end poverty, announcing an additional £340 million allocated to tackling homelessness. In the cabinet reshuffle, John Healey became Chancellor of the Exchequer, Wes Streeting Defence Secretary, Ed Miliband Foreign Secretary, Shabana Mahmood Home Secretary, Yvette Cooper Health Secretary, and Angela Rayner Housing Secretary.
Following Burnham's arrival, opinion polls have shown a clear "Burnham effect" in favor of Labour. According to Survation, Labour rose from 19% before Starmer's resignation to 26%, overtaking Reform UK (24%); More In Common and DeltaPoll confirmed a similar recovery. This rise has been supported by cost-of-living measures taken in Burnham's first week — scrapping a levy on electricity bills, capping bus fares, and cutting taxes for pubs and bars. Meanwhile, Nigel Farage's Reform UK has faced controversy over a £5 million donation from a cryptocurrency billionaire, and Farage has called on Burnham to call an early election to establish legitimacy.
On fiscal policy, more than 120 British millionaires — including Gary Lineker — signed an open letter called "Proud to Pay," urging the new Prime Minister to raise taxes on wealth. The Patriotic Millionaires group argued that wealth and power are concentrated among a small segment of society and proposed that additional revenue be used to reduce inequality, support public infrastructure, and channel resources to small businesses. Burnham responded that "we need a greater sense of fairness," while Chief Secretary to the Treasury Emma Reynolds avoided any firm commitment, saying major tax changes would be addressed in the budget.
Projections released by the National Institute of Economic and Social Research (NIESR) on 29 July summarize the challenges facing the Burnham government: the Institute revised its 2026 growth forecast upward, noting the economy's surprising resilience despite the shock from the Iran war, while also raising its inflation forecast — average 2026 inflation is now expected at 3.1%, peaking at 3.8% in February 2027, with a return to the 2% target now pushed to early 2029 rather than the previously projected 2028. NIESR Director David Aikman noted that Burnham inherits a difficult legacy: public spending eroded by inflation, the highest borrowing costs in the G7, new spending demands, and cost-of-living pressures all converging at once. The Institute estimates that Chancellor Healey will need to find an additional £24 billion by the end of the decade to protect public services and real-terms benefits.
The Bank of England's next interest rate decision is due on 30 July 2026 — one day after this report's publication — so an assessment of that decision is left to next month's report. However, the Citi/YouGov survey released on 28 July shows public inflation expectations declining, which could ease some of the concerns held by policymakers about inflation becoming entrenched.
Against this political and economic backdrop, this report aims to present a comprehensive overview of the UK economy as of July 2026, drawing on the latest official data across key areas: growth, inflation, the labor market, foreign trade, and the housing market.
i. Economic Growth
According to ONS's monthly growth bulletin released on 16 July 2026, the UK economy grew by 0.7% in the March–May 2026 period compared to the previous three months. This marks the sixth consecutive quarter of growth, following 0.8% growth in February–April and 0.6% in January–March. The services sector contributed most to growth, expanding by 0.7%, while construction grew by 1.6% and manufacturing by 0.1%.
Quarterly Growth Index

On a monthly basis, GDP grew by 0.1% in May 2026, following a 0.1% contraction in April. May's growth was driven by a 0.3% rise in services, partly offset by a 0.5% contraction in production and a 0.8% contraction in construction. On an annual basis, GDP grew by 1.1% in March–May 2026 compared to the same period last year, and was 1.3% higher in May 2026 year-on-year. Services grew by 1.5% and production by 0.3% during this period, while construction shrank by 1.4%.
Services Sector
Services output rose by 0.7% in March–May 2026, contributing the most to GDP growth. Twelve of fourteen service sub-sectors recorded growth; the strongest positive contribution came from information and communication (2.5%), supported by 3.7% growth in IT programming and consultancy and 1.9% growth in telecommunications. Professional, scientific and technical activities (1.8%) and human health and social work activities (0.7%) also contributed positively. In contrast, administrative and support services fell by 1.1%, driven by a 3.2% decline in building-related services. In May, the strongest monthly contribution came from professional, scientific and technical activities (1.8%), supported by a 5.1% rise in scientific research and development linked to strong momentum in medical sciences.
Production Sector
The production sector grew by 0.1% in March–May 2026, entirely driven by a 1.6% rise in manufacturing, largely offset by declines of 4.3% in electricity, gas, steam and air conditioning supply, 1.9% in water supply and waste management, and 1.5% in mining and quarrying. Within manufacturing, the strongest contribution came from basic pharmaceutical products (5.4%), followed by basic metals and metal products (2.7%) and food, beverages and tobacco products (1.7%). In contrast, machinery and equipment manufacturing fell by 1.5% and electrical equipment manufacturing by 2.2%. On a monthly basis, production output fell by 0.5% in May, mainly due to a 4.6% decline in mining and quarrying.
Construction Sector
Construction output rose by 1.6% in March–May 2026 compared to the previous three months. Repair and maintenance activity grew by 2.1% and new construction by 1.1%; within repair and maintenance, the strongest contribution came from non-residential repair and maintenance (3.0% growth), while in new work, private commercial new construction expanded by 4.0%. On a monthly basis, construction output fell by 0.8% in May, entirely attributable to a sharp 5.0% contraction in private housing repair and maintenance. New work continued to grow by 0.2% in the same month.
Impact of the Iran War on the Real Economy, and Outlook
In its assessment of May 2026 data, the ONS noted that the Iranian conflict, which began in late February, has been cited by businesses as a factor behind reduced output across many sectors, including manufacturing, wholesale trade, road transport, storage, accommodation, travel agencies, and creative arts and entertainment. 5% of trading businesses reported global supply chain disruption in May 2026, with half citing the Middle East as the cause. Leading indicators for June present a mixed picture: heatwave-related transport disruptions reduced retail footfall, while annual growth in automotive fuel demand slowed despite falling global oil prices. On the other hand, there are cautious signs of improvement in the labor market, with potential layoffs declining from the exceptionally high level seen in May. NIESR, in its updated 29 July projection, raised its 2026 growth forecast, highlighting the economy's resilience despite the energy shock, but reiterated its expectation of a slowdown toward year-end.
ii. Inflation
According to the ONS bulletin released on 22 July 2026, CPIH (which includes owner-occupier housing costs) rose 2.8% year-on-year in June 2026, below May's 3.0% and marking the lowest 12-month rate since September 2024. CPI, the government's official inflation target measure, rose 2.6% year-on-year in June, down from 2.8% in May. On a monthly basis, CPIH rose 0.2% and CPI rose 0.1%. Core CPIH and core CPI (excluding energy, food, alcohol and tobacco) remained unchanged at 2.8% and 2.6% respectively.
Inflation Rate

The main driver of the inflation slowdown was transport: transport prices rose 5.7% year-on-year in June, down from 6.8% in May. This slowdown was largely due to falling diesel prices, which dropped by 10.7 pence per litre between May and June to 176.4 pence, while petrol fell by 2.1 pence to 155.3 pence. This was the first monthly decline in fuel prices since the Middle East conflict began on 28 February 2026. Even so, motor fuel prices remain 21.3% higher year-on-year (down from May's 24.6%, the highest rate since September 2022). Annual food and non-alcoholic beverage price inflation also eased from 2.2% to 1.7%, its lowest level since August 2024, while clothing and footwear prices fell 0.5% year-on-year.
In international comparison, the UK's 2.6% CPI rate is below the EU average (2.9%), but above France (2.0%) and Germany (2.4%). The Bank of England, in its latest statement, confirmed that inflation eased to 2.8%, while noting that the war in the Middle East has pushed up energy prices and that it expects inflation to rise again as this feeds through to business costs and wage demands.
According to NIESR's updated 29 July projections, average inflation for 2026 is expected to reach 3.1%, peaking at 3.8% in February 2027 following updates to the energy price cap, with a return to the 2% target now expected only in early 2029 rather than the previously forecast 2028. However, the Citi/YouGov survey released on 28 July offers a more encouraging signal: public inflation expectations for one year ahead fell from 3.8% in June to 3.4% in July, and expectations for five years and beyond fell from 3.9% to 3.7%. Citibank noted that this sharp decline suggests expectations are approaching pre-conflict levels and that the risk of expectations becoming entrenched has diminished. Separately, the government's "Great British Summer Savings" program — announced 21 May and effective 25 June, which cuts VAT on everyday activities — was not yet reflected in June's data and is expected to have only a limited effect on July's inflation figures.
iii. Wages and Labor Market
According to labor market data, the UK employment rate stood at 75.1% in March–May 2026, down 0.1 percentage points year-on-year but up 0.1 points quarter-on-quarter. The unemployment rate was 4.9% over the same period, up 0.2 points year-on-year but down 0.1 points quarter-on-quarter. The economic inactivity rate was 20.9%, down 0.1 points both year-on-year and quarter-on-quarter. According to HMRC's PAYE Real Time Information (RTI) data, the number of payrolled employees fell by 85,000 (0.3%) between May 2025 and May 2026; early estimates for June 2026 indicate a year-on-year decline of 71,000 (0.2%), leaving payrolled employment at around 30.3 million.
As of June 2026, the estimated number of Universal Credit claimants was 1.689 million, up on a monthly basis but down year-on-year. The number of job vacancies fell by 7,000 (0.9%) to 712,000 in April–June 2026 compared to the previous quarter. The ONS noted a divergence this quarter between the Labour Force Survey (LFS) and RTI data — the LFS showed employment rising by 115,000 while RTI showed a decline of 30,000 — attributing this partly to an LFS operational issue in May 2026 (a temporary shortfall in phone-based data collection capacity), though the impact on headline indicators was said to be limited.
Unemployment Rate (%, Seasonally Adjusted)

According to the Average Weekly Earnings bulletin, annual growth in employees' regular pay (excluding bonuses) held steady at 3.4% for a third consecutive period in March–May 2026, suggesting the slowdown from 5.9% in February 2025 has paused. Annual growth in total pay (including bonuses) rose to 4.3%, up from 3.9% in the December–February period. Inflation-adjusted (CPIH-based) real regular pay growth was 0.3%, and real total pay growth was 1.1%. As of May 2026, average weekly earnings stood at £749 for total pay and £699 for pay excluding bonuses.
Annual regular pay growth in the public sector was 5.5%, notably above the private sector's 2.9%; part of this gap reflects a base effect from some NHS staff pay increases being paid earlier in 2026 than in 2025. By sector, after the public sector, the strongest regular pay growth was in wholesale and retail trade, hotels and restaurants (3.6%), while the weakest was in construction, which fell 0.2% year-on-year. An estimated 26,000 working days were lost to labor disputes in May 2026.
Weekly Wages Growth Rate (%, Seasonally Adjusted)

According to NIESR's latest projections, continued labor market weakening is expected, with unemployment peaking at 5.5% in Q4 2026, while wage growth is expected to slow to 3.3% in 2027. The Work Foundation's assessment found that private sector wages have lagged behind price growth since October 2025, with real weekly earnings £1.75 lower year-on-year; only one in five businesses plans to raise wages above inflation in 2026. In this context, the government's decision to remove VAT from household electricity bills aims to provide some relief for workers under cost-of-living pressure.
iv. Foreign Trade
The value of goods imports rose by £0.5 billion (0.8%) in May 2026 compared to the previous month, driven by a £0.8 billion (3.2%) rise in imports from non-EU countries, partly offset by a £0.4 billion (1.2%) fall in imports from the EU. Goods exports rose by £1.5 billion (4.5%), mostly driven by a £1.2 billion (7.3%) rise in exports to non-EU countries, with the remainder from a £0.3 billion (1.8%) rise in exports to the EU. As of May, imports from the EU exceeded imports from non-EU countries by £2.8 billion, while exports to the EU were £1.0 billion below exports to non-EU countries.
Goods Imports
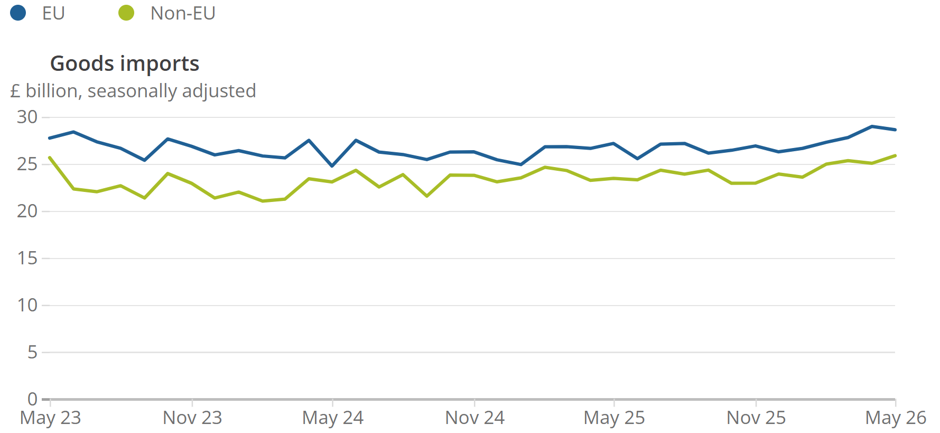
On a three-month basis, the total goods and services trade deficit widened by £4.4 billion compared to the three months to February, reaching £9.1 billion in the three months to May. The goods trade deficit widened by £3.1 billion to £60.9 billion, while the services trade surplus narrowed by £1.3 billion to £51.8 billion. Over the same period, goods imports rose by £9.0 billion (5.9%) and goods exports by £5.8 billion (6.2%), while services imports rose by around £1.2 billion (1.4%) and services exports fell by £0.1 billion (0.1%).
By commodity, the decline in EU imports was mainly driven by machinery and transport equipment (due to lower car imports from Germany) and fuels (due to lower refined petroleum imports from the Netherlands). The rise in non-EU imports was driven by fuels (+£0.6 billion, from higher crude oil imports from Nigeria and Norway and refined petroleum from the US and Nigeria) and a general increase in chemical products (+£0.2 billion). On the export side, the rise in exports to non-EU countries was largely driven by chemicals (+£0.5 billion, from higher medicinal/pharmaceutical and inorganic chemical exports to the US) and manufactured materials (+£0.3 billion, from higher non-ferrous metal exports to the US).
Goods Exports

The slight decline in services exports coincided with firms surveyed in the S&P Global UK Services PMI citing global economic uncertainty and intense competition. Overall, the impact of the Iran war on global energy prices and supply chains continues to shape the UK's trade balance, through both import costs and commodity flows.
v. Housing Market
According to Lloyds Bank's June 2026 House Price Index, UK house prices rose for the first time in four months, increasing 0.2% month-on-month in June, following a 0.2% decline in May. The average house price rose from £298,812 in May to £299,330 in June. Annual price growth rose from 0.5% in May to 0.6%. Lloyds noted that price movements continue to reflect the impact of global developments on inflation and interest rate expectations, and that while affordability remains challenging for many buyers, mortgage rates have eased from their recent peaks, offering some encouragement to those considering a move.
Regionally, the highest annual price growth was recorded in Northern Ireland at 7.4%, with an average price of £229,000. Scotland saw 3.9% growth to £223,277, and Wales 0.9% to £231,142. Within England, momentum in the north remains strong: the North East rose 2.8% to £181,133 and the North West 2.4% to £248,218. In contrast, prices continued to fall in southern markets: the South East fell 2.0% year-on-year to £381,654, and London fell 1.1% to £534,831. Annual price growth for first-time buyers rose from 0.3% in May to 0.8% in June, with the average first-time buyer price reaching £240,433, indicating resilient demand.
Average Housing Prices

According to HMRC data, seasonally adjusted housing transactions fell 2.0% month-on-month in May 2026 to 98,450, while non-seasonally-adjusted transactions rose 7.0% month-on-month. In the three months to May, transaction volumes were up 1.2% on the previous three months and up 16.6% year-on-year. In contrast, Bank of England data showed mortgage approvals fell 14.9% month-on-month in May to 56,205 — 10.8% lower than May 2025 — indicating that loan application activity has softened following the interest rate spike seen earlier in the year.
According to the Royal Institution of Chartered Surveyors (RICS) May 2026 Residential Market Survey, the net balance for new buyer enquiries was -34%, the net balance for agreed sales remained unchanged at -37%, and the net balance for new property listings was -8%. These figures suggest overall market activity remains weak but is beginning to stabilize after recent declines. Lloyds expects the housing market to continue moving at a measured pace, with falling borrowing costs providing some support for demand, while affordability constraints remain a significant factor; the path of prices is expected to depend largely on continued disinflation and a gradual recovery in household confidence.


Comments